
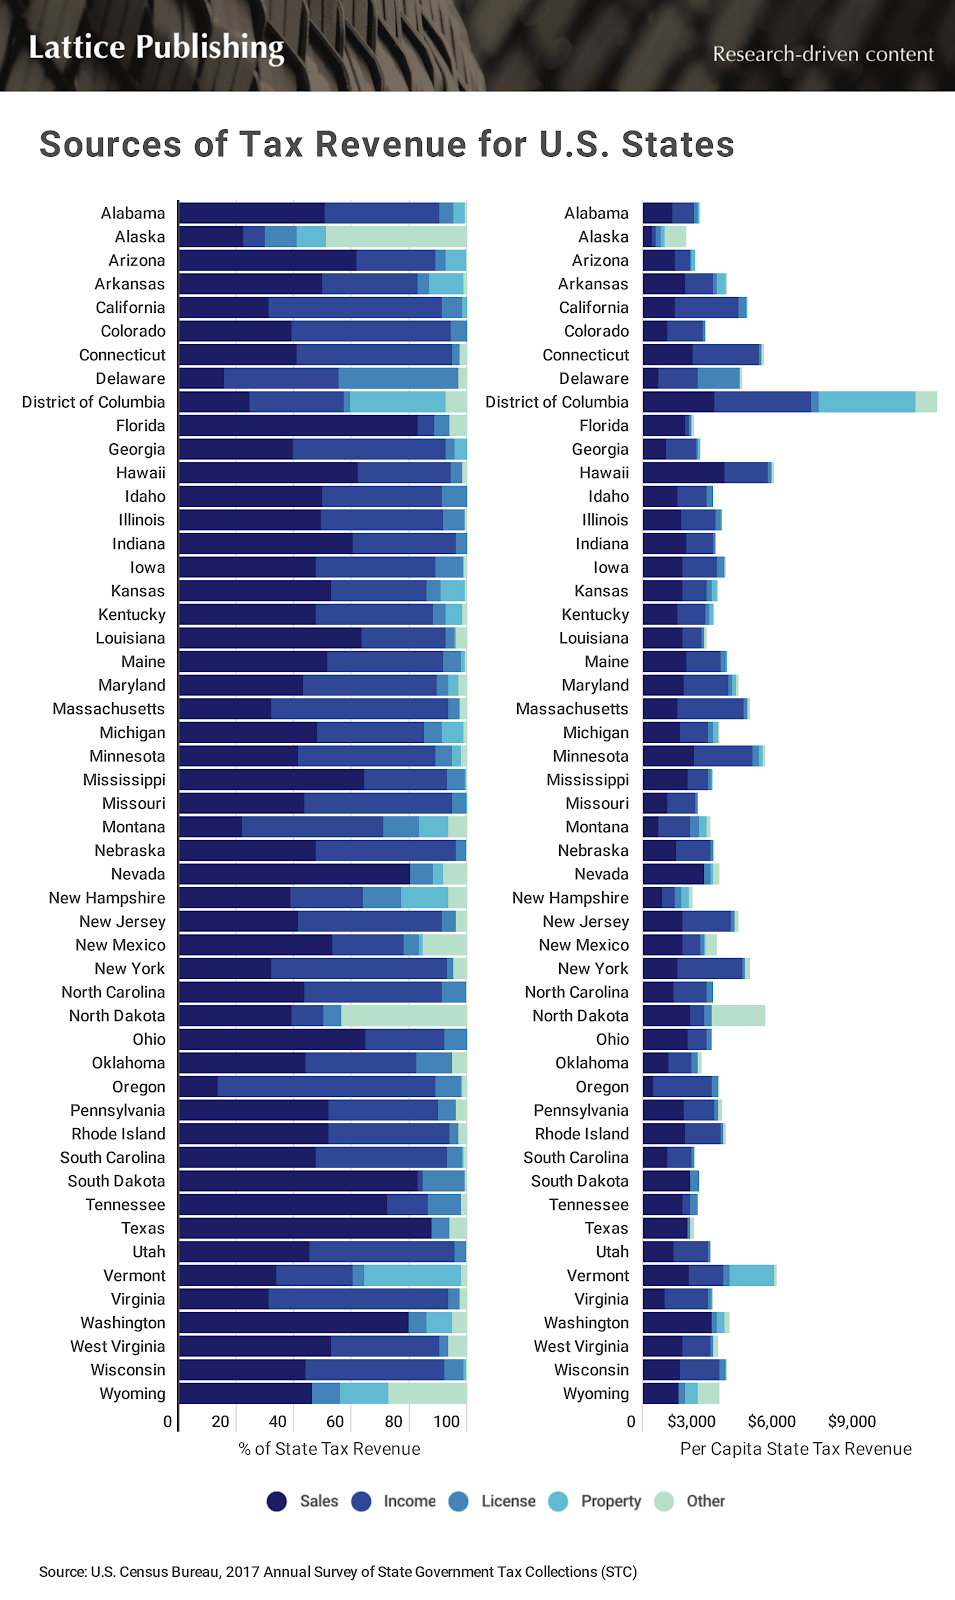
With the end of the year approaching, Americans are beginning to turn their attention towards tax season. In addition to $3.3 trillion in federal taxes, last year Americans paid $950.5 billion in state taxes distributed across sales, income, property, license, and other taxes. Across all states, sales and gross receipts taxes were the largest source of state tax revenue, followed closely by income taxes; however, the breakdown of tax revenue by state varies widely.
Most Americans are aware that their pocketbooks will be affected differently depending on what part of the country they live in, but few understand just how their hard-earned dollars are converted into funds used to support state education, health care, transportation, and other public services. How states choose to collect taxes impacts both the amount that citizens have to pay every year and the primary vehicles through which they pay them.
Some states rely on income taxes as their primary method for taxing its residents, while other states impose larger sales or property taxes. U.S. Census data shows that Oregon, for example, collects just 13.4% of its revenues from sales and gross receipts tax, while the same tax accounts for 87.4% of Texas’ state collections. North Dakota extensively taxes natural resource extraction via its severance tax, accounting for nearly 44% of the $3.5 billion in taxes the state collected in 2017. New York, on the other hand, collected a full 61% of its $79.7 billion in taxes from income tax alone. Given the wide range in tax policies from state to state, it can be extremely difficult to determine how much you’d pay in total from one state to another.
To better understand the largest sources of tax revenue for each state, researchers at Lattice Publishing analyzed data from the Census Bureau’s 2017 Annual Survey of State Government Tax Collections. Its researchers calculated per capita tax amounts across the survey’s broad taxation categories: income, property, sales and gross receipts, licensing, and ‘other’. Here are the key insights from the analysis:
Takeaways
- The total per capita tax burden has a wide spread across the states. The state with the lowest per capita burden is Alaska, at $1,608 per person per year. The state with the highest burden is Vermont, at $5,015. While not a state, Washington, D.C. far exceeds any other territory, at $11,028 per capita. The average per capita annual tax burden across all states is $2,918.
- Sales and income tax make up the lion’s share of state tax revenue, accounting for 89.5% of all taxes collected at the state level. Nineteen states collect at least half of their tax revenue from sales and gross receipts taxes alone, while ten states collect more than half of their revenue from income taxes (including both individual and corporate).
- Just four states collect a double-digit share of their tax revenue from sources other than the primary categories (income, property, sales, and license): New Mexico, North Dakota, Alaska, and Wyoming. Each of these states relies heavily on severance taxes, which are taxes on natural resource extraction.
- Seven states receive at least 10% of their tax revenues from licensing. However, Delaware has the distinction of receiving a whopping 41.9% of its taxes from licensing, due to it being a popular state for businesses to incorporate.
Tax Revenue Breakdown by State

Photo Credit: Bruce Len / Alamy Stock Photo
1. Alabama
- Largest source of tax revenue: Sales and gross receipts tax
- Total taxes: $2,137 per person
- Income taxes: $850 per person (39.8% of total)
- Sales and gross receipts taxes: $1,076 per person (50.4% of total)
- Property taxes: $81 per person (3.8% of total)
- License taxes: $109 per person (5.1% of total)
- Other taxes: $21 per person (1% of total)

Photo Credit: Jeffrey Wickett – RF / Alamy Stock Photo
2. Alaska
- Largest source of tax revenue: Other taxes (primarily severance tax)
- Total taxes: $1,608 per person
- Income taxes: $119 per person (7.4% of total)
- Sales and gross receipts taxes: $356 per person (22.1% of total)
- Property taxes: $163 per person (10.2% of total)
- License taxes: $182 per person (11.3% of total)
- Other taxes: $788 per person (49% of total)

Photo Credit: incamerastock / Alamy Stock Photo
3. Arizona
- Largest source of tax revenue: Sales and gross receipts tax
- Total taxes: $1,979 per person
- Income taxes: $544 per person (27.5% of total)
- Sales and gross receipts taxes: $1,217 per person (61.5% of total)
- Property taxes: $142 per person (7.2% of total)
- License taxes: $72 per person (3.6% of total)
- Other taxes: $5 per person (0.3% of total)

Photo Credit: Paul Brady / Alamy Stock Photo
4. Arkansas
- Largest source of tax revenue: Sales and gross receipts tax
- Total taxes: $3,168 per person
- Income taxes: $1,053 per person (33.3% of total)
- Sales and gross receipts taxes: $1,565 per person (49.4% of total)
- Property taxes: $379 per person (12% of total)
- License taxes: $128 per person (4% of total)
- Other taxes: $42 per person (1.3% of total)

Photo Credit: Alan Crosthwaite / Alamy Stock Photo
5. California
- Largest source of tax revenue: Income tax
- Total taxes: $3,936 per person
- Income taxes: $2,385 per person (60.6% of total)
- Sales and gross receipts taxes: $1,213 per person (30.8% of total)
- Property taxes: $68 per person (1.7% of total)
- License taxes: $266 per person (6.8% of total)
- Other taxes: $4 per person (0.1% of total)

Photo Credit: charles nolder / Alamy Stock Photo
6. Colorado
- Largest source of tax revenue: Income tax
- Total taxes: $2,354 per person
- Income taxes: $1,306 per person (55.5% of total)
- Sales and gross receipts taxes: $915 per person (38.9% of total)
- Property taxes: $0 per person (0% of total)
- License taxes: $133 per person (5.7% of total)
- Other taxes: $0 per person (0% of total)

Photo Credit: LEE SNIDER / Alamy Stock Photo
7. Connecticut
- Largest source of tax revenue: Income tax
- Total taxes: $4,555 per person
- Income taxes: $2,468 per person (54.2% of total)
- Sales and gross receipts taxes: $1,853 per person (40.7% of total)
- Property taxes: $0 per person (0% of total)
- License taxes: $123 per person (2.7% of total)
- Other taxes: $111 per person (2.4% of total)

Photo Credit: Jon Bilous / Alamy Stock Photo
8. Delaware
- Largest source of tax revenue: License tax
- Total taxes: $3,731 per person
- Income taxes: $1,484 per person (39.8% of total)
- Sales and gross receipts taxes: $579 per person (15.5% of total)
- Property taxes: $0 per person (0% of total)
- License taxes: $1,563 per person (41.9% of total)
- Other taxes: $106 per person (2.8% of total)

Photo Credit: Sean Pavone / Alamy Stock Photo
9. District of Columbia
- Largest source of tax revenue: Property tax
- Total taxes: $11,028 per person
- Income taxes: $3,620 per person (32.8% of total)
- Sales and gross receipts taxes: $2,681 per person (24.3% of total)
- Property taxes: $3,655 per person (33.1% of total)
- License taxes: $267 per person (2.4% of total)
- Other taxes: $803 per person (7.3% of total)

Photo Credit: Sean Pavone / Alamy Stock Photo
10. Florida
- Largest source of tax revenue: Sales and gross receipts tax
- Total taxes: $1,917 per person
- Income taxes: $114 per person (5.9% of total)
- Sales and gross receipts taxes: $1,589 per person (82.9% of total)
- Property taxes: $0 per person (0% of total)
- License taxes: $97 per person (5.1% of total)
- Other taxes: $117 per person (6.1% of total)

Photo Credit: Sean Pavone / Alamy Stock Photo
11. Georgia
- Largest source of tax revenue: Income tax
- Total taxes: $2,150 per person
- Income taxes: $1,146 per person (53.3% of total)
- Sales and gross receipts taxes: $845 per person (39.3% of total)
- Property taxes: $95 per person (4.4% of total)
- License taxes: $65 per person (3% of total)
- Other taxes: $0 per person (0% of total)

Photo Credit: Sorin Colac / Alamy Stock Photo
12. Hawaii
- Largest source of tax revenue: Sales and gross receipts tax
- Total taxes: $4,924 per person
- Income taxes: $1,597 per person (32.4% of total)
- Sales and gross receipts taxes: $3,058 per person (62.1% of total)
- Property taxes: $0 per person (0% of total)
- License taxes: $189 per person (3.8% of total)
- Other taxes: $80 per person (1.6% of total)

Photo Credit: Gregory Johnston / Alamy Stock Photo
13. Idaho
- Largest source of tax revenue: Sales and gross receipts tax
- Total taxes: $2,627 per person
- Income taxes: $1,093 per person (41.6% of total)
- Sales and gross receipts taxes: $1,308 per person (49.8% of total)
- Property taxes: $0 per person (0% of total)
- License taxes: $223 per person (8.5% of total)
- Other taxes: $3 per person (0.1% of total)

Photo Credit: incamerastock / Alamy Stock Photo
14. Illinois
- Largest source of tax revenue: Sales and gross receipts tax
- Total taxes: $2,967 per person
- Income taxes: $1,260 per person (42.5% of total)
- Sales and gross receipts taxes: $1,455 per person (49.1% of total)
- Property taxes: $5 per person (0.2% of total)
- License taxes: $218 per person (7.4% of total)
- Other taxes: $28 per person (0.9% of total)

Photo Credit: Jessica Kirsh / Alamy Stock Photo
15. Indiana
- Largest source of tax revenue: Sales and gross receipts tax
- Total taxes: $2,708 per person
- Income taxes: $969 per person (35.8% of total)
- Sales and gross receipts taxes: $1,634 per person (60.4% of total)
- Property taxes: $2 per person (0.1% of total)
- License taxes: $102 per person (3.8% of total)
- Other taxes: $0 per person (0% of total)

Photo Credit: Natalia Kuzmina / Alamy Stock Photo
16. Iowa
- Largest source of tax revenue: Sales and gross receipts tax
- Total taxes: $3,101 per person
- Income taxes: $1,299 per person (41.9% of total)
- Sales and gross receipts taxes: $1,466 per person (47.3% of total)
- Property taxes: $1 per person (0% of total)
- License taxes: $301 per person (9.7% of total)
- Other taxes: $34 per person (1.1% of total)

Photo Credit: Henryk Sadura / Alamy Stock Photo
17. Kansas
- Largest source of tax revenue: Sales and gross receipts tax
- Total taxes: $2,806 per person
- Income taxes: $932 per person (33.2% of total)
- Sales and gross receipts taxes: $1,477 per person (52.6% of total)
- Property taxes: $235 per person (8.4% of total)
- License taxes: $145 per person (5.2% of total)
- Other taxes: $18 per person (0.6% of total)

Photo Credit: GeoStills / Alamy Stock Photo
18. Kentucky
- Largest source of tax revenue: Sales and gross receipts tax
- Total taxes: $2,673 per person
- Income taxes: $1,089 per person (40.8% of total)
- Sales and gross receipts taxes: $1,268 per person (47.4% of total)
- Property taxes: $159 per person (6% of total)
- License taxes: $112 per person (4.2% of total)
- Other taxes: $44 per person (1.6% of total)

Photo Credit: Sean Pavone / Alamy Stock Photo
19. Louisiana
- Largest source of tax revenue: Sales and gross receipts tax
- Total taxes: $2,371 per person
- Income taxes: $692 per person (29.2% of total)
- Sales and gross receipts taxes: $1,497 per person (63.2% of total)
- Property taxes: $15 per person (0.6% of total)
- License taxes: $79 per person (3.3% of total)
- Other taxes: $88 per person (3.7% of total)

Photo Credit: Enrico Della Pietra / Alamy Stock Photo
20. Maine
- Largest source of tax revenue: Sales and gross receipts tax
- Total taxes: $3,168 per person
- Income taxes: $1,280 per person (40.4% of total)
- Sales and gross receipts taxes: $1,621 per person (51.2% of total)
- Property taxes: $29 per person (0.9% of total)
- License taxes: $206 per person (6.5% of total)
- Other taxes: $33 per person (1% of total)

Photo Credit: Sean Pavone / Alamy Stock Photo
21. Maryland
- Largest source of tax revenue: Income tax
- Total taxes: $3,569 per person
- Income taxes: $1,664 per person (46.6% of total)
- Sales and gross receipts taxes: $1,527 per person (42.8% of total)
- Property taxes: $128 per person (3.6% of total)
- License taxes: $143 per person (4% of total)
- Other taxes: $107 per person (3% of total)

Photo Credit: Diego Grandi / Alamy Stock Photo
22. Massachusetts
- Largest source of tax revenue: Income tax
- Total taxes: $4,012 per person
- Income taxes: $2,467 per person (61.5% of total)
- Sales and gross receipts taxes: $1,286 per person (32% of total)
- Property taxes: $1 per person (0% of total)
- License taxes: $162 per person (4% of total)
- Other taxes: $96 per person (2.4% of total)

Photo Credit: Linda Parton / Alamy Stock Photo
23. Michigan
- Largest source of tax revenue: Sales and gross receipts tax
- Total taxes: $2,874 per person
- Income taxes: $1,072 per person (37.3% of total)
- Sales and gross receipts taxes: $1,375 per person (47.8% of total)
- Property taxes: $213 per person (7.4% of total)
- License taxes: $179 per person (6.2% of total)
- Other taxes: $34 per person (1.2% of total)

Photo Credit: rudi1976 / Alamy Stock Photo
24. Minnesota
- Largest source of tax revenue: Income tax
- Total taxes: $4,590 per person
- Income taxes: $2,185 per person (47.6% of total)
- Sales and gross receipts taxes: $1,902 per person (41.4% of total)
- Property taxes: $153 per person (3.3% of total)
- License taxes: $265 per person (5.8% of total)
- Other taxes: $85 per person (1.8% of total)

Photo Credit: RSBPhoto / Alamy Stock Photo
25. Mississippi
- Largest source of tax revenue: Sales and gross receipts tax
- Total taxes: $2,608 per person
- Income taxes: $752 per person (28.8% of total)
- Sales and gross receipts taxes: $1,672 per person (64.1% of total)
- Property taxes: $10 per person (0.4% of total)
- License taxes: $161 per person (6.2% of total)
- Other taxes: $14 per person (0.5% of total)

Photo Credit: Daniel J. Rao / Alamy Stock Photo
26. Missouri
- Largest source of tax revenue: Income tax
- Total taxes: $2,044 per person
- Income taxes: $1,056 per person (51.7% of total)
- Sales and gross receipts taxes: $884 per person (43.2% of total)
- Property taxes: $5 per person (0.3% of total)
- License taxes: $97 per person (4.7% of total)
- Other taxes: $2 per person (0.1% of total)

Photo Credit: Gary Tognoni / Alamy Stock Photo
27. Montana
- Largest source of tax revenue: Income tax
- Total taxes: $2,527 per person
- Income taxes: $1,240 per person (49.1% of total)
- Sales and gross receipts taxes: $549 per person (21.7% of total)
- Property taxes: $261 per person (10.3% of total)
- License taxes: $314 per person (12.4% of total)
- Other taxes: $163 per person (6.4% of total)

Photo Credit: Matt Bills / Alamy Stock Photo
28. Nebraska
- Largest source of tax revenue: Income tax
- Total taxes: $2,658 per person
- Income taxes: $1,298 per person (48.9% of total)
- Sales and gross receipts taxes: $1,254 per person (47.2% of total)
- Property taxes: $0 per person (0% of total)
- License taxes: $95 per person (3.6% of total)
- Other taxes: $10 per person (0.4% of total)

Photo Credit: Edwin Verin / Alamy Stock Photo
29. Nevada
- Largest source of tax revenue: Sales and gross receipts tax
- Total taxes: $2,877 per person
- Income taxes: $0 per person (0% of total)
- Sales and gross receipts taxes: $2,309 per person (80.3% of total)
- Property taxes: $100 per person (3.5% of total)
- License taxes: $222 per person (7.7% of total)
- Other taxes: $245 per person (8.5% of total)

Photo Credit: Sean Pavone / Alamy Stock Photo
30. New Hampshire
- Largest source of tax revenue: Sales and gross receipts tax
- Total taxes: $1,859 per person
- Income taxes: $476 per person (25.6% of total)
- Sales and gross receipts taxes: $714 per person (38.4% of total)
- Property taxes: $302 per person (16.2% of total)
- License taxes: $246 per person (13.2% of total)
- Other taxes: $122 per person (6.5% of total)

Photo Credit: joel zatz / Alamy Stock Photo
31. New Jersey
- Largest source of tax revenue: Income tax
- Total taxes: $3,590 per person
- Income taxes: $1,784 per person (49.7% of total)
- Sales and gross receipts taxes: $1,487 per person (41.4% of total)
- Property taxes: $1 per person (0% of total)
- License taxes: $172 per person (4.8% of total)
- Other taxes: $146 per person (4.1% of total)

Photo Credit: John Sirlin / Alamy Stock Photo
32. New Mexico
- Largest source of tax revenue: Sales and gross receipts tax
- Total taxes: $2,766 per person
- Income taxes: $685 per person (24.8% of total)
- Sales and gross receipts taxes: $1,470 per person (53.1% of total)
- Property taxes: $39 per person (1.4% of total)
- License taxes: $147 per person (5.3% of total)
- Other taxes: $425 per person (15.3% of total)

Photo Credit: Andriy Kravchenko / Alamy Stock Photo
33. New York
- Largest source of tax revenue: Income tax
- Total taxes: $4,014 per person
- Income taxes: $2,451 per person (61.1% of total)
- Sales and gross receipts taxes: $1,278 per person (31.8% of total)
- Property taxes: $0 per person (0% of total)
- License taxes: $91 per person (2.3% of total)
- Other taxes: $194 per person (4.8% of total)

Photo Credit: Chris Boswell / Alamy Stock Photo
34. North Carolina
- Largest source of tax revenue: Income tax
- Total taxes: $2,614 per person
- Income taxes: $1,250 per person (47.8% of total)
- Sales and gross receipts taxes: $1,139 per person (43.6% of total)
- Property taxes: $0 per person (0% of total)
- License taxes: $218 per person (8.3% of total)
- Other taxes: $7 per person (0.3% of total)

Photo Credit: Randall Runtsch / Alamy Stock Photo
35. North Dakota
- Largest source of tax revenue: Other taxes (primarily severance tax)
- Total taxes: $4,587 per person
- Income taxes: $504 per person (11% of total)
- Sales and gross receipts taxes: $1,786 per person (38.9% of total)
- Property taxes: $6 per person (0.1% of total)
- License taxes: $283 per person (6.2% of total)
- Other taxes: $2,008 per person (43.8% of total)

Photo Credit: Michelle Himes Studio / Alamy Stock Photo
36. Ohio
- Largest source of tax revenue: Sales and gross receipts tax
- Total taxes: $2,599 per person
- Income taxes: $719 per person (27.7% of total)
- Sales and gross receipts taxes: $1,679 per person (64.6% of total)
- Property taxes: $0 per person (0% of total)
- License taxes: $197 per person (7.6% of total)
- Other taxes: $4 per person (0.2% of total)

Photo Credit: Amanda Bannister / Alamy Stock Photo
37. Oklahoma
- Largest source of tax revenue: Sales and gross receipts tax
- Total taxes: $2,180 per person
- Income taxes: $835 per person (38.3% of total)
- Sales and gross receipts taxes: $958 per person (43.9% of total)
- Property taxes: $0 per person (0% of total)
- License taxes: $270 per person (12.4% of total)
- Other taxes: $117 per person (5.4% of total)

Photo Credit: Jason Rothe / Alamy Stock Photo
38. Oregon
- Largest source of tax revenue: Income tax
- Total taxes: $2,876 per person
- Income taxes: $2,175 per person (75.6% of total)
- Sales and gross receipts taxes: $386 per person (13.4% of total)
- Property taxes: $5 per person (0.2% of total)
- License taxes: $258 per person (9% of total)
- Other taxes: $52 per person (1.8% of total)

Photo Credit: Sean Pavone / Alamy Stock Photo
39. Pennsylvania
- Largest source of tax revenue: Sales and gross receipts tax
- Total taxes: $2,956 per person
- Income taxes: $1,125 per person (38.1% of total)
- Sales and gross receipts taxes: $1,533 per person (51.9% of total)
- Property taxes: $3 per person (0.1% of total)
- License taxes: $175 per person (5.9% of total)
- Other taxes: $120 per person (4% of total)

Photo Credit: Sean Pavone / Alamy Stock Photo
40. Rhode Island
- Largest source of tax revenue: Sales and gross receipts tax
- Total taxes: $3,083 per person
- Income taxes: $1,292 per person (41.9% of total)
- Sales and gross receipts taxes: $1,597 per person (51.8% of total)
- Property taxes: $2 per person (0.1% of total)
- License taxes: $104 per person (3.4% of total)
- Other taxes: $88 per person (2.9% of total)

Photo Credit: Sean Pavone / Alamy Stock Photo
41. South Carolina
- Largest source of tax revenue: Sales and gross receipts tax
- Total taxes: $1,956 per person
- Income taxes: $899 per person (46% of total)
- Sales and gross receipts taxes: $923 per person (47.2% of total)
- Property taxes: $7 per person (0.4% of total)
- License taxes: $103 per person (5.3% of total)
- Other taxes: $23 per person (1.2% of total)

Photo Credit: Chris Boswell / Alamy Stock Photo
42. South Dakota
- Largest source of tax revenue: Sales and gross receipts tax
- Total taxes: $2,103 per person
- Income taxes: $35 per person (1.7% of total)
- Sales and gross receipts taxes: $1,745 per person (83% of total)
- Property taxes: $0 per person (0% of total)
- License taxes: $310 per person (14.7% of total)
- Other taxes: $12 per person (0.6% of total)

Photo Credit: Sean Pavone / Alamy Stock Photo
43. Tennessee
- Largest source of tax revenue: Sales and gross receipts tax
- Total taxes: $2,069 per person
- Income taxes: $294 per person (14.2% of total)
- Sales and gross receipts taxes: $1,491 per person (72.1% of total)
- Property taxes: $0 per person (0% of total)
- License taxes: $244 per person (11.8% of total)
- Other taxes: $40 per person (2% of total)

Photo Credit: be.you.tiful / Stockimo / Alamy Stock Photo
44. Texas
- Largest source of tax revenue: Sales and gross receipts tax
- Total taxes: $1,894 per person
- Income taxes: $0 per person (0% of total)
- Sales and gross receipts taxes: $1,657 per person (87.5% of total)
- Property taxes: $0 per person (0% of total)
- License taxes: $121 per person (6.4% of total)
- Other taxes: $116 per person (6.1% of total)

Photo Credit: Zoonar GmbH / Alamy Stock Photo
45. Utah
- Largest source of tax revenue: Income tax
- Total taxes: $2,525 per person
- Income taxes: $1,274 per person (50.4% of total)
- Sales and gross receipts taxes: $1,138 per person (45.1% of total)
- Property taxes: $0 per person (0% of total)
- License taxes: $104 per person (4.1% of total)
- Other taxes: $10 per person (0.4% of total)

Photo Credit: Jon Bilous / Alamy Stock Photo
46. Vermont
- Largest source of tax revenue: Sales and gross receipts tax
- Total taxes: $5,015 per person
- Income taxes: $1,323 per person (26.4% of total)
- Sales and gross receipts taxes: $1,697 per person (33.8% of total)
- Property taxes: $1,694 per person (33.8% of total)
- License taxes: $204 per person (4.1% of total)
- Other taxes: $97 per person (1.9% of total)

Photo Credit: Sherry Smith / Alamy Stock Photo
47. Virginia
- Largest source of tax revenue: Income tax
- Total taxes: $2,623 per person
- Income taxes: $1,639 per person (62.5% of total)
- Sales and gross receipts taxes: $817 per person (31.1% of total)
- Property taxes: $4 per person (0.1% of total)
- License taxes: $101 per person (3.9% of total)
- Other taxes: $62 per person (2.4% of total)

Photo Credit: MIHAI ANDRITOIU / Alamy Stock Photo
48. Washington
- Largest source of tax revenue: Sales and gross receipts tax
- Total taxes: $3,240 per person
- Income taxes: $0 per person (0% of total)
- Sales and gross receipts taxes: $2,589 per person (79.9% of total)
- Property taxes: $283 per person (8.7% of total)
- License taxes: $196 per person (6.1% of total)
- Other taxes: $172 per person (5.3% of total)

Photo Credit: Sean Pavone / Alamy Stock Photo
49. West Virginia
- Largest source of tax revenue: Sales and gross receipts tax
- Total taxes: $2,804 per person
- Income taxes: $1,063 per person (37.9% of total)
- Sales and gross receipts taxes: $1,472 per person (52.5% of total)
- Property taxes: $4 per person (0.1% of total)
- License taxes: $82 per person (2.9% of total)
- Other taxes: $183 per person (6.5% of total)

Photo Credit: Sean Pavone / Alamy Stock Photo
50. Wisconsin
- Largest source of tax revenue: Income tax
- Total taxes: $3,129 per person
- Income taxes: $1,510 per person (48.3% of total)
- Sales and gross receipts taxes: $1,376 per person (44% of total)
- Property taxes: $23 per person (0.7% of total)
- License taxes: $203 per person (6.5% of total)
- Other taxes: $17 per person (0.5% of total)

Photo Credit: Robert Garrigus / Alamy Stock Photo
51. Wyoming
- Largest source of tax revenue: Sales and gross receipts tax
- Total taxes: $2,847 per person
- Income taxes: $0 per person (0% of total)
- Sales and gross receipts taxes: $1,316 per person (46.2% of total)
- Property taxes: $473 per person (16.6% of total)
- License taxes: $280 per person (9.8% of total)
- Other taxes: $778 per person (27.3% of total)
Methodology
The data used in this analysis is from the U.S. Census Bureau 2017 Annual Survey of State Government Tax Collections. Detailed tax categories were grouped into five broad categories (income taxes, sales and gross receipts taxes, property taxes, license taxes, and ‘other’ taxes). Sales and gross receipts taxes include both general and selective sales tax. License taxes include collections on alcohol, hunting, incorporation, motor vehicles, and a range of other items. Income tax includes both individual and corporate income. The ‘other’ category is composed of death and gift taxes, documentary and stock transfer taxes, severance taxes, and NEC taxes.
For each state, the largest source of tax revenue was determined based on the relative percentage breakdown across the five broad categories. Per capita tax amounts were determined using state population figures from the U.S. Census Bureau 2017 Annual Estimates of the Resident Population.